Saturday, October 22, 2022

Jamovi ROC Curve, AUC & Diagnostic Test Accuracy

In this tutorial, we will demonstrate how to perform ROC (Receiver Operator Characteristic) graphs and AUC (the area under the curve) easily using jamovi software.

1- Download Jamovi

2- Install ("psychoPDA: Psychometrics & Post-Data Analysis") module within jamovi library. See how.

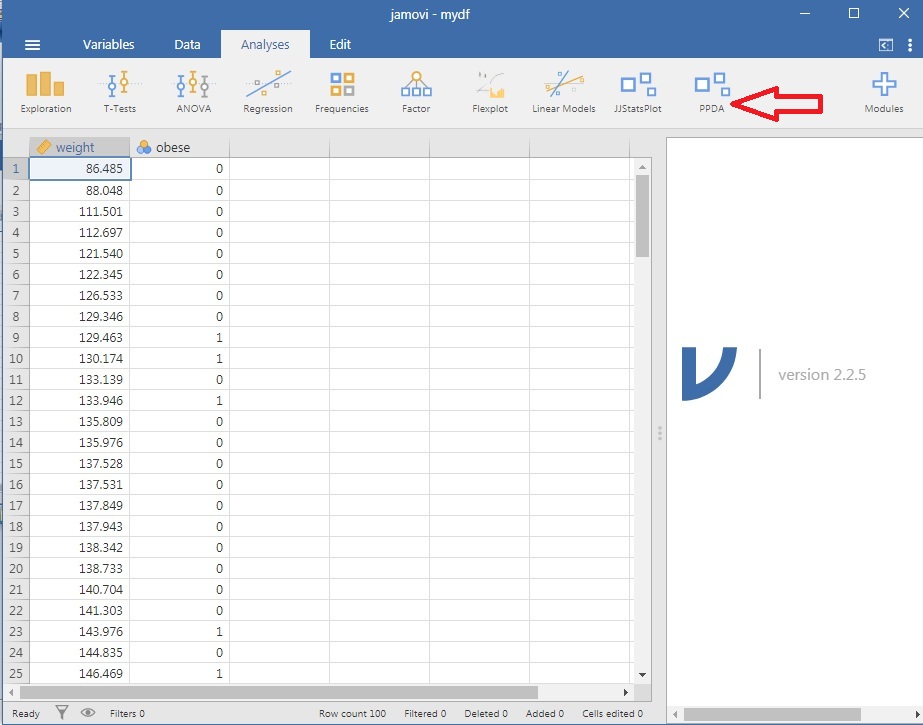
3- Click on "PPDA" module 


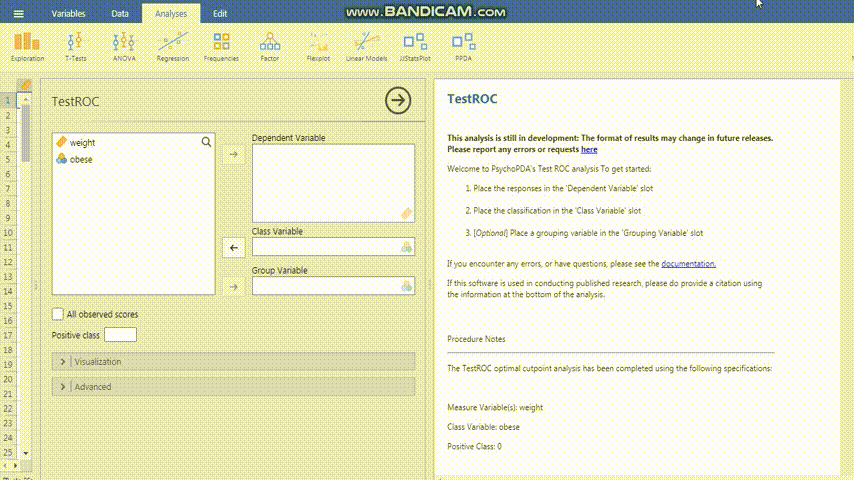
4-Choose TestROC (Test Response Operating Characteristic module ) 


5- Place the column containing responses (the results of your diagnostic test e.g. the measured values of a new marker) in the 'Dependent Variable' slot.

6- Place the column containg classification obtained by the gold standard test in the 'Class Variable' slot as a binary variable (yes/no - Diseased/not diseased)

7- At "positive class", type "yes" or "Diseased" or "1" as suitable from your dataset.

8 -[Optional] Place a grouping variable in the 'Grouping Variable' slot e.g "sex" or "status" being a case or a control..etc

9- Automatically, Jamovi will calculate senstivity, specificity, Positive Predictive Value (PPV), Negative Predictive Value (NPV) and Youden's Index of the “optimal” cutpoints in "Results table" .

10- If desired, the values used to calculate sensitivty and specificity at each observed score/cutpoint can be provided in a series of tables by checking "senstivity-specificity tables" under "visualization".

11- ROC curves are automatically plotted with sensitivity is on the y-axis, and 1 - specificity is on the x-axis. 

12- Final optimal cut-off point depends on being clinically relevant. Many indices were proposed to help. ( Reference 1 , Reference 2)


N.B. PPDA's TestROC is based on "cutpointr" R package (view @CRAN). [Thiele, C., & Hirschfeld, G. (2021). cutpointr: Improved Estimation and Validation of Optimal Cutpoints in R. Journal of Statistical Software, 98(11), 1–27. https://doi.org/10.18637/jss.v098.i11]


https://lucasjfriesen.github.io/jamoviPsychoPDA_docs/measureDiagnostics_testROC_comprehensive.html


Sunday, October 16, 2022

understanding logarithms of Bayes factors...JJStatsPlot module output in Jamovi and ggstatsplot in R .

A Bayes factor is the ratio of the likelihood of one particular hypothesis to the likelihood of another. It can be interpreted as a measure of the strength of evidence in favor of one theory among two competing theories.

Bayes factor gives us a way to evaluate the data in favor of a null hypothesis,

 If the BF01 is 5 then it means the null hypothesis is 5 times as likely as the alternative hypothesis given the data. Conversely, if the BF01 is 1/5 then it means that the alternative hypothesis is 5 times as likely as the null hypothesis given the data.

N.B: BF10 = 1/BF01.

BF10 indicates the Bayes factor in favor of H1 over H0, whereas BF01 indicates the Bayes factor in favor of H0 over H1.

-----------

If loge(BF01) is

then you have…

≥ 2

Extreme evidence for H0

1.5-  <2

Very strong evidence for H0

1-      <1.5

Strong evidence for H0

.5- <1

Moderate evidence for H0

0 - <.5

Anecdotal/weak evidence for H0


No evidence

Negative

Anecdotal evidence for H1

Moderate evidence for H1

Strong evidence for H1

Very strong evidence for H1

Extreme evidence for H1


loge (BF01) = -0.18 means that there is more evidence for the alternative hypothesis but it's anecdotal/weak.


-----------


The default Cauchy is centered on 0 and has a scale factor "r" that determines the width. 

This scale factor happens to equal the interquartile range, such that, when r=0.707 for instance, 50% of the prior mass lies in the interval from -0.707 to +0.707.

JZS: Jeffreys-Zellner-Siow prior..
 

N.B. Any comments, explanations, additions or corrections are welcome

Update: I found a great video explaining similar results at yuzaR Data Science channel; from which I found this great explanation:


Resources:

https://ptfonseca.github.io/pcal/reference/bfactor_log_interpret.html

https://www.statology.org/bayes-factor/

https://www.statisticshowto.com/bayes-factor-definition/

https://forum.cogsci.nl/discussion/3236/setting-cauchy-prior-scaling-in-bayesian-t-test-use-related-effect-size